What is a Data Analyst?
Businesses need to understand their data
The world is becoming more data driven. Businesses need to understand and act on their data to positively affect change within their business. The choices made off the data impacts the business and ultimately the bottom line.
Storytelling through data analysis is becoming a vital component and aspect of large and small businesses.
A data analyst tells the story
A data analyst can tell a story with business data to help business leaders make precise decisions.
What a data analyst does
Data analysis is the process of identifying, cleaning, transforming, and modeling data to discover meaningful and useful information.
The data is then crafted into a story through reports for analysis to support the critical decision-making process.
Data analytics are divided into five categories:
| Descriptive | Diagnostic | Predictive | Prescriptive | Cognitive |
| help answer questions about what has happened based on historical data. | help answer questions about why events happened. | help answer questions about what will happen in the future. | help answer questions about which actions should be taken to achieve a goal or target. | a self-learning feedback loop that draws on experience to grow. |
| Descriptive analytics techniques summarize large datasets to describe outcomes to stakeholders. | Diagnostic analytics techniques supplement basic descriptive analytics, and they use the findings from descriptive analytics to discover the cause of these events. | Predictive analytics techniques identify trends and determine if they’re likely to recur using historical data. | target. By using insights from predictive analytics, organizations can make data-driven decisions. | Cognitive analytics help you learn what might happen if circumstances change and determine how you might handle these situations. |
Power BI
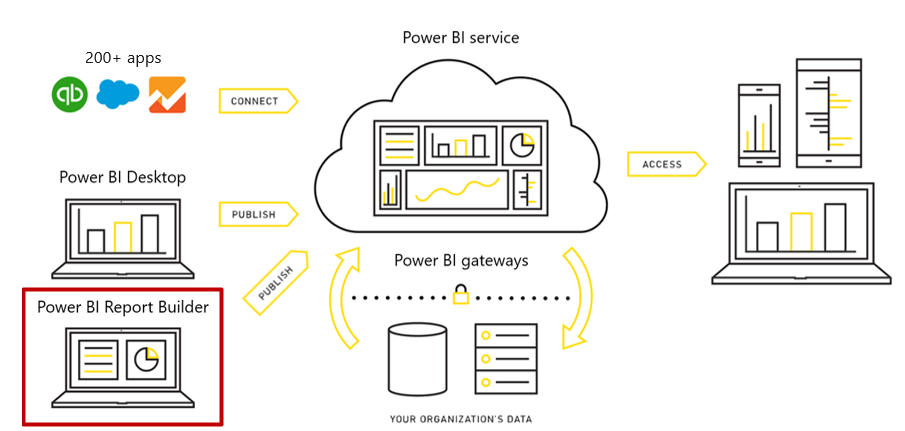
The Power BI Data Analyst tells the story through Power BI. Power BI is a business analytics service provided by Microsoft that lets you visualize your data and share insights. Data is shaped and modelled to build interactive dashboards and Business Intelligence reports.
About me

I’m a certified accountant and a data analyst with a passion for growth and development. My goal is to help others be fully self-expressed at work by getting them past the data and the tools they need to function.
Let me explain.
How many times have you compromised yourself to work within the limitations of the tools and software you use everyday? How much time have you lost cleaning up data, filling out forms, and performing highly repetitious tasks? How many times have you wished your software did that one simple thing that prevents you from really getting things done?
I study the data and the processes and I find ways to get you the the information you need to act and act quickly. I get you past the data and the ERP so you can get to work. Self-actualization comes from the ability to express yourself with confidence. I get you past low-level activities like data cleanup, or manually assembling reports, and make sure you have the information you need to act. You can then spend your time on high-level activities that drive your business and your success.
My passion is to help others succeed. I firmly believe in the expanding pie and that all ships rise on the incoming tide.
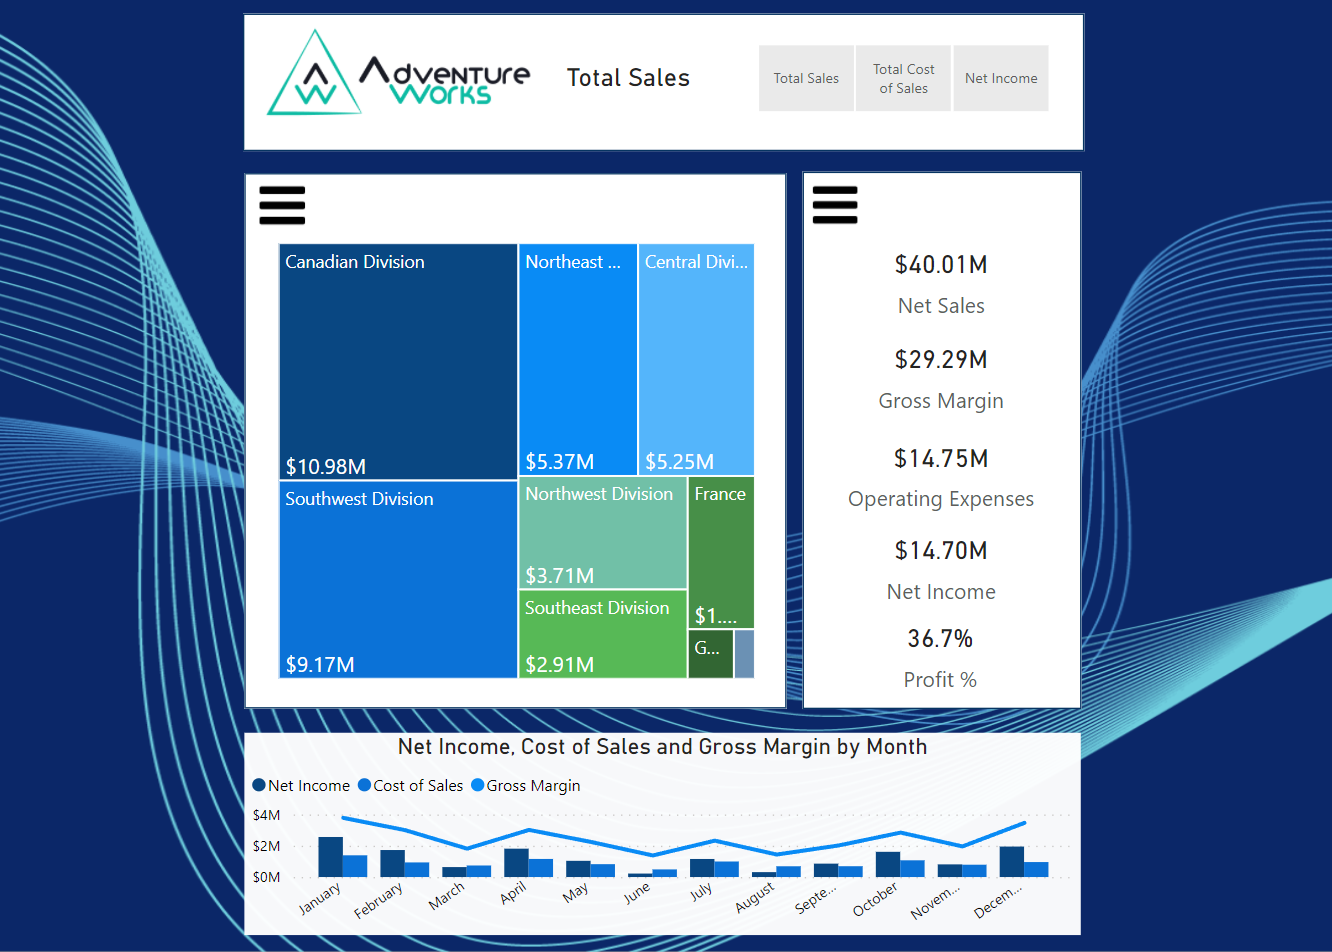
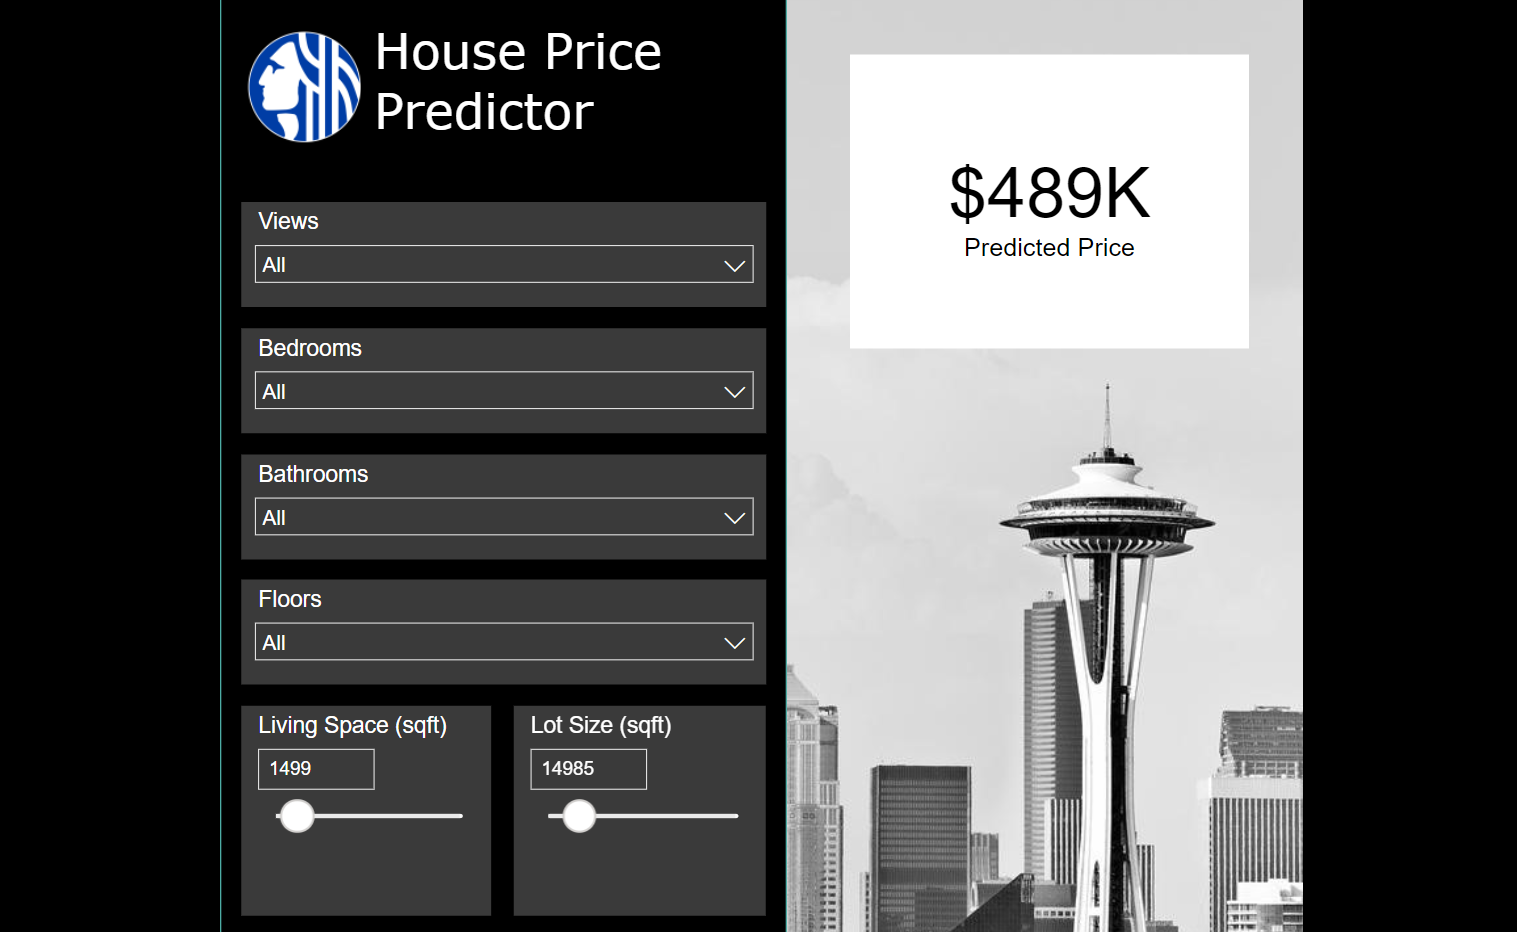
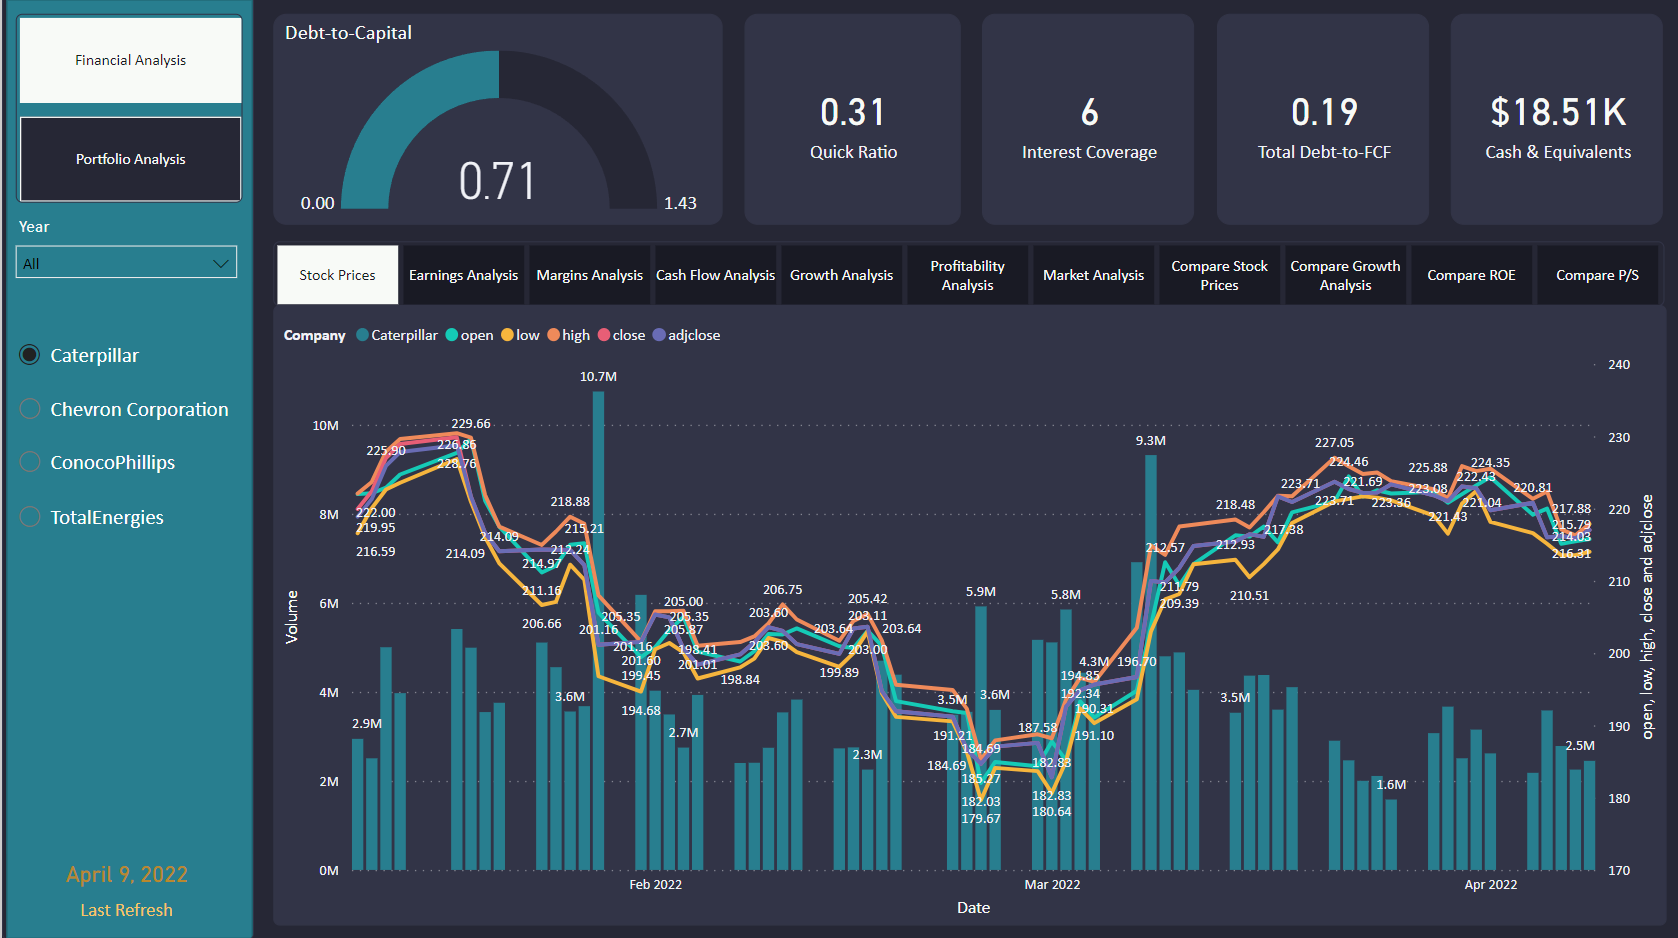
Some samples of the work I can do: