I chose this project because I wanted to explore Power BI and R script to do statistical analysis. When I found a dataset online of Seattle home prices 2014-2015 I thought this was a perfect case. My goal here was to test the data, create a predictive model, test the predictive model and then create a user interface for the user.
Then I came across Diana Arciniega’s article where she literally chose the same data for a multiple regression analysis. Her choice for a user interface with the dataset is so sublimely simple that I immediately decided I wanted to emulate her solution.
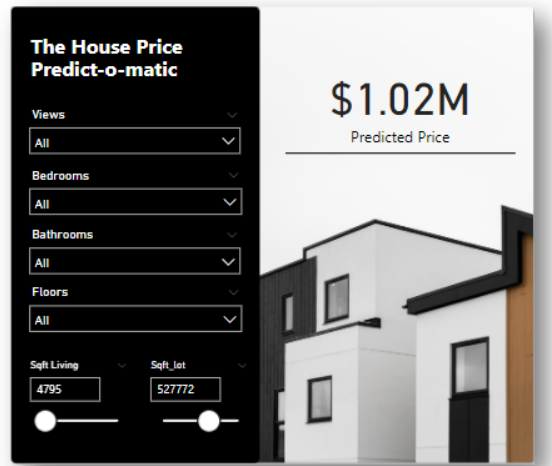
My approach to this problem differed substantially from Diana. I used R script in power query to calculate the slope of the independent variables and the adjusted R Square and R. This meant I could just use the exported results instead of creating Dax formulas. I created a dynamic scatter gram to compare the dependent value price against multiple independent variables. I built a test of correlation, covariance, fit and residuals to test the predictive power of the model. And the model itself doesn’t plug in the slope numbers but instead looks them up using LOOKUPVALUE. This allowed me to change the parameters in the R script to test the impact of adding and removing independent variables to try to get the strongest fit.
The real point of this short blog post is sing praises of Diane’s solution. That interface is simply beautiful.
You can check out Diana Arciniega’s blog “How to Do Multiple Linear Regression in Power BI” here.
Thank you so much for the shout out!!!
Would love to learn more about “I built a test of correlation, covariance, fit and residuals to test the predictive power of the model.” – did you do this all in R?
I want to figure out how to leverage Power BI in this way, or educate on how to test the model first before trying regression in PBI.
Thank you again, means a lot!
You’re welcome! I’m flattered by your response, tbh. And, a little embarrassed as I’m just in the process of setting up this portfolio. I started by studying two articles from Syncfusion- “Statistics Fundamentals” and “Statistics using Excel”. I highly recommend testing in Excel to get an understanding. Further research and I started testing in R Studio and then loaded the R script in power query to build the tables that I could then call on in the solution. I hope that helps, and feel free to bounce questions off me. I’m honestly just scratching the surface of what we could be doing with R and Python.
That helps incredibly. When I have the time, I will try your recommendations. Thank you very much!
Maybe we can do a collaboration sometime if you are interested!
Sure! Send me an email and we can brainstorm! mgregor@botpit.onmicrosoft.com